Queens Park Rangers
England
Queens Park Rangers Latest Results
FT
02/05/26
07:30
 Ipswich Town
 Queens Park Rangers
3
0
FT
25/04/26
10:00
Queens Park Rangers
 Derby County
2
3
FT
21/04/26
14:45
Queens Park Rangers
 Swansea City
1
2
FT
18/04/26
07:30
 Millwall
Queens Park Rangers
Millwall
Queens Park Rangers
2
0
FT
11/04/26
07:30
Queens Park Rangers
 Bristol City
0
0
FT
06/04/26
10:00
 Preston North End
Queens Park Rangers
Preston North End
Queens Park Rangers
1
1
FT
03/04/26
10:00
Queens Park Rangers
 Watford
2
1
FT
21/03/26
11:00
Queens Park Rangers
 Portsmouth
6
1
FT
14/03/26
11:00
 Leicester City
Queens Park Rangers
Leicester City
Queens Park Rangers
1
3
FT
11/03/26
15:45
 Birmingham City
Queens Park Rangers
Birmingham City
Queens Park Rangers
1
0
Queens Park Rangers Fixtures
11/07/26
12:30
 First Vienna
Queens Park Rangers
First Vienna
Queens Park Rangers
16/07/26
12:30
 Fortuna Wiener Neustadt
Queens Park Rangers
Fortuna Wiener Neustadt
Queens Park Rangers
21/07/26
08:00
Queens Park Rangers
 Wycombe Wanderers
Season Stats
GP
W
D
L
G
GD
TP
PPG
Home form
23
10
3
10
40:37
+3
33
1.43
Away form
23
6
7
10
21:36
-15
25
1.09
Overall form
46
16
10
20
61:73
-12
58
1.26
GP
W
D
L
G
GD
TP
PPG
Home form
23
9
9
5
18:12
+6
36
1.57
Away form
23
2
9
12
8:26
-18
15
0.65
Overall form
46
11
18
17
26:38
-12
51
1.11
GP
W
D
L
G
GD
TP
PPG
Home form
23
8
6
9
22:25
-3
30
1.30
Away form
23
6
13
4
13:10
+3
31
1.35
Overall form
46
14
19
13
35:35
0
61
1.33
Scored Goals
Scored per game
Overall
Home
Away
Scored / match
1.33
1.74
0.91
Minutes / goal scored
68
52
99
Over 0.5
72%
83%
61%
Over 1.5
33%
48%
18%
Over 2.5
20%
27%
14%
Scored in both halves
27%
40%
14%
First team to score
33%
48%
18%
Failed to score
29%
18%
40%
Highest score in a match
6
6
3
Penalties won
3
1
2
Penalties conceded
4
3
1
Penalty in a match
16%
18%
14%
Scored 1st half
Overall
Home
Away
Scored average 1H
0.57
0.78
0.35
Scored in 1H
44%
57%
31%
Failed to score 1H
57%
44%
70%
1H Goals scored
26
18
8
Scored 2nd half
Overall
Home
Away
Scored average 2H
0.76
0.96
0.57
Scored in 2H
55%
66%
44%
Failed to score 2H
46%
35%
57%
2H Goals scored
35
22
13
Queens Park Rangers scores a goal every 68 minutes in Championship
Queens Park Rangers scores an average of 1.33 goals every game
Queens Park Rangers is the first team to score in 33% during Championship
Queens Park Rangers fails to score in 29% in Championship
Conceded Goals
Conceded per game
Overall
Home
Away
Conceded / match
1.59
1.61
1.57
Minutes / goal conceded
57’
56’
58’
Clean sheets %
22%
18%
27%
Over 0.5
79%
83%
74%
Over 1.5
42%
48%
35%
Over 2.5
22%
22%
22%
Highest conceded in a match
7
4
7
Conceded 1st half
Overall
Home
Away
Conceded average 1H
0.83
0.52
1.13
Clean sheets 1H
22%
14%
8%
1H Goals conceded
38
12
26
Conceded 2nd half
Overall
Home
Away
Conceded average 2H
0.76
1.09
0.43
Clean sheets 2H
23%
7%
16%
2H Goals conceded
35
25
10
Queens Park Rangers concedes a goal every 57 minutes in Championship
Queens Park Rangers concedes an average of 1.59 goals every game
Queens Park Rangers achieves 22% clean sheets in Championship
Over / Under Goals
Over goals / full time
Overall
Home
Away
Match goals average
2.91
3.35
2.48
Over 0.5
87%
92%
83%
Over 1.5
77%
87%
66%
Over 2.5
64%
79%
48%
Over 3.5
37%
44%
31%
Over 4.5
18%
27%
9%
Over 5.5
5%
5%
5%
Under goals / full time
Overall
Home
Away
Under 0.5
14%
9%
18%
Under 1.5
24%
14%
35%
Under 2.5
37%
22%
53%
Under 3.5
64%
57%
70%
Under 4.5
83%
74%
92%
Under 5.5
96%
96%
96%
Over X goals 1H
Overall
Home
Away
Average 1H
1.39
1.30
1.48
Over 0.5 1H
74%
74%
74%
Over 1.5 1H
42%
35%
48%
Over 2.5 1H
14%
14%
14%
Under X goals 1H
Overall
Home
Away
Under 0.5 1H
27%
27%
27%
Under 1.5 1H
59%
66%
53%
Under 2.5 1H
87%
87%
87%
Over X goals 2H
Overall
Home
Away
Average 2H
1.52
2.04
1.00
Over 0.5 2H
72%
87%
57%
Over 1.5 2H
50%
66%
35%
Over 2.5 2H
29%
48%
9%
Under X goals 2H
Overall
Home
Away
Under 0.5 2H
29%
14%
44%
Under 1.5 2H
50%
35%
66%
Under 2.5 2H
72%
53%
92%
Over / Under Goals are calculated from total match goals for fixtures that Queens Park Rangers has participated in Championship
Queens Park Rangers total goals per match 2.91 every game in Championship
The percentage of matches with Over 2.5 goals is 64% for Queens Park Rangers in Championship
The percentage of matches with Under 3.5 goals is 64% for Queens Park Rangers in Championship
BTTS Statistics
Full time
1st half / 2nd half
BTTS Statistics
Overall
Home
Away
BTTS
64%
74%
53%
BTTS both halves
5%
9%
0%
BTTS and win
27%
35%
18%
BTTS and draw
9%
5%
14%
BTTS and lose
29%
35%
22%
BTTS and over 2.5 (yes/yes)
55%
70%
40%
BTTS and over 2.5 (no/yes)
9%
9%
9%
BTTS and over 3.5 (yes/yes)
33%
40%
27%
BTTS and over 3.5 (no/yes)
5%
5%
5%
BTTS stats 1H/2H
Overall
Home
Away
BTTS 1H
22%
22%
22%
BTTS 2H
33%
48%
18%
BTTS 1H and 2H (yes/yes)
5%
9%
0%
BTTS 1H and 2H (yes/no)
18%
14%
22%
BTTS 1H and 2H (no/yes)
29%
40%
18%
BTTS 1H and 2H (no/no)
50%
40%
61%
Queens Park Rangers achieves both teams to score in 64% of matches in Championship
Queens Park Rangers records both teams to score in the 1st half in 22% of matches in Championship
Queens Park Rangers has both teams scoring in the 2nd half in 33% of matches in Championship
Time of Goals
10 mins
15 mins
10 mins
Total Goals
Scored
Conceded
0 - 10 mins
27%
9%
18%
11 - 20 mins
24%
9%
16%
21 - 30 mins
27%
14%
14%
31 - 40 mins
37%
11%
27%
41 - 50 mins
37%
18%
22%
51 - 60 mins
35%
14%
24%
61 - 70 mins
22%
11%
11%
71 - 80 mins
22%
14%
9%
81 - 90+ mins
48%
37%
22%
15 mins
Total Goals
Scored
Conceded
0 - 15 mins
40%
16%
27%
31 - 45+ mins
35%
16%
20%
46 - 60+ mins
48%
20%
31%
46 - 60 mins
61%
22%
42%
61 - 75 mins
31%
18%
16%
76 - 90+ mins
57%
44%
27%
Queens Park Rangers sees the most goals in matches during the 81-90+ minutes, making up 48% of goals in Championship
Queens Park Rangers sees the most goals scored in matches during the 81-90+ minutes, making up 37% of goals in Championship
Queens Park Rangers sees the most goals conceded in matches during the 31-40 minutes, making up 27% of goals in Championship
Queens Park Rangers sees the most goals in matches during the 46-60 minutes, making up 61% of goals in Championship
Queens Park Rangers sees the most goals scored in matches during the 76-90+ minutes, making up 44% of goals in Championship
Queens Park Rangers sees the most goals conceded in matches during the 46-60 minutes, making up 42% of goals in Championship
Handicap Statistics
Handicap
Overall
Home
Away
+2.5
90%
92%
87%
+1.5
79%
83%
74%
+0.5
57%
57%
57%
-0.5
35%
44%
27%
-1.5
18%
22%
14%
-2.5
7%
14%
0%
Handicap
Overall
Home
Away
+1.5
83%
92%
74%
+0.5
64%
79%
48%
-0.5
24%
40%
9%
-1.5
7%
9%
5%
Handicap
Overall
Home
Away
+1.5
92%
87%
96%
+0.5
72%
61%
83%
-0.5
31%
35%
27%
-1.5
11%
9%
14%
Queens Park Rangers records the most success in the +2.5, achieving 90% in Championship
In the 1st half, Queens Park Rangers records the most success in the +1.5, achieving 83% in Championship
In the 2nd half, Queens Park Rangers sees the highest performance in the +1.5, with 92% in Championship
Cards
Match cards
Overall
Home
Away
Match cards average
3.76
3.96
3.57
Team cards average
1.85
2.00
1.70
Cards against average
1.91
1.96
1.87
Wins
40%
35%
44%
Handicap +1.5
81%
79%
83%
Handicap +0.5
59%
61%
57%
Handicap -0.5
40%
35%
44%
Handicap -1.5
27%
31%
22%
Over 0.5
96%
92%
100%
Over 1.5
87%
87%
87%
Over 2.5
81%
83%
79%
Over 3.5
57%
61%
53%
Over 4.5
22%
27%
18%
Over 5.5
18%
22%
14%
Over 6.5
9%
9%
9%
Over 7.5
5%
9%
0%
Total Cards
173
91
82
Highest in a match
10
10
7
Lowest in a match
0
0
1
Cards 1H
Overall
Home
Away
Cards average 1H
1.22
1.04
1.39
Team cards average 1H
0.61
0.57
0.65
Cards against average 1H
0.61
0.48
0.74
Wins 1H
33%
31%
35%
Handicap +1.5
92%
96%
87%
Handicap +0.5
74%
83%
66%
Handicap -0.5
33%
31%
35%
Handicap -1.5
3%
0%
5%
Over 0.5
70%
66%
74%
Over 1.5
33%
31%
35%
Over 2.5
14%
9%
18%
Team cards over 0.5
50%
48%
53%
Team cards over 1.5
11%
9%
14%
Cards against over 0.5
44%
44%
44%
Cards against over 1.5
14%
5%
22%
Cards 2H
Overall
Home
Away
Cards average 2H
2.54
2.91
2.17
Team cards average 2H
1.24
1.43
1.04
Cards against average 2H
1.30
1.48
1.13
Wins 2H
37%
40%
35%
Handicap +1.5
81%
79%
83%
Handicap +0.5
66%
70%
61%
Handicap -0.5
37%
40%
35%
Handicap -1.5
14%
14%
14%
Over 0.5
90%
92%
87%
Over 1.5
74%
83%
66%
Over 2.5
53%
61%
44%
Over 3.5
24%
31%
18%
Team cards over 0.5
68%
70%
66%
Team cards over 1.5
40%
44%
35%
team cards over 2.5
14%
22%
5%
Cards against over 0.5
74%
83%
66%
Cards against over 1.5
42%
48%
35%
cards against over 2.5
14%
18%
9%
Queens Park Rangers wins by cards in 40% of matches in Championship
Queens Park Rangers has an average of 3.76 cards in matches of Championship
In the 1st half, Queens Park Rangers wins by cards in 33% of matches in Championship
In the 1st half, Queens Park Rangers has an average of 1.22 cards in matches of Championship
In the 2nd half, Queens Park Rangers wins by cards in 37% of matches in Championship
In the 2nd half, Queens Park Rangers has an average of 2.54 cards in matches of Championship
Corner Statistics
Match corners
Overall
Home
Away
Match corners average
10.04
9.22
10.87
Team corners average
4.83
5.39
4.26
Corners against average
5.22
3.83
6.61
Wins
42%
61%
22%
Handicap +2.5
64%
83%
44%
Handicap +1.5
55%
83%
27%
Handicap -1.5
35%
48%
22%
Handicap -2.5
33%
48%
18%
Over 6.5
85%
83%
87%
Over 7.5
79%
74%
83%
Over 8.5
70%
74%
66%
Over 9.5
50%
48%
53%
Over 10.5
37%
27%
48%
Over 11.5
29%
14%
44%
Over 12.5
22%
14%
31%
Over 13.5
14%
9%
18%
Corners 1H
Overall
Home
Away
Corners average 1H
4.50
3.74
5.26
Team corners average 1H
2.11
2.26
1.96
Corners against average 1H
2.39
1.48
3.30
Wins 1H
44%
66%
22%
Handicap +2.5
79%
87%
70%
Handicap +1.5
70%
83%
57%
Handicap -1.5
29%
40%
18%
Handicap -2.5
11%
14%
9%
Over 4.5
42%
31%
53%
Over 5.5
24%
18%
31%
Over 6.5
20%
14%
27%
Team corners over 2.5
35%
40%
31%
Team corners over 3.5
22%
22%
22%
Corners against over 2.5
44%
27%
61%
Corners against over 3.5
24%
9%
40%
Corners 2H
Overall
Home
Away
Corners average 2H
5.54
5.48
5.61
Team corners average 2H
2.72
3.13
2.30
Corners against average 2H
2.83
2.35
3.30
Wins 2H
33%
44%
22%
Handicap +2.5
79%
92%
66%
Handicap +1.5
72%
83%
61%
Handicap -1.5
27%
35%
18%
Handicap -2.5
18%
27%
9%
Over 4.5
70%
70%
70%
Over 5.5
55%
53%
57%
Over 6.5
29%
35%
22%
Team corners over 2.5
53%
61%
44%
Team corners over 3.5
27%
40%
14%
Corners against over 2.5
48%
40%
57%
Corners against over 3.5
29%
22%
35%
Queens Park Rangers wins by corners in 42% of matches in Championship
Queens Park Rangers has an average of 10.04 corners in matches of Championship
In the 1st half, Queens Park Rangers wins by corners in 44% of matches in Championship
Queens Park Rangers has an average of 4.50 corners in matches of Championship
In the 2nd half, Queens Park Rangers wins by corners in 33% of matches in Championship
Queens Park Rangers has an average of 5.54 corners in matches of Championship
Player Statistics
#
Goals+Assists
-
1 Burrell R. FW13
-
2 Kone R. FW12
-
3 Madsen N. MD9
-
4 Vale H. MD9
-
5 Smyth P. MD9
-
6 Dunne J. DF6
-
7 Kolli R. FW5
-
8 Chair I. MD4
-
9 Saito K. MD4
-
10 Morgan K. DF3
-
11 Mbengue A. DF2
-
12 Varane J. MD2
-
13 Norrington-Davies R. DF2
-
14 Hayden I. MD2
-
15 Bennie D. MD2
-
16 Edwards R. DF2
-
17 Morrison L. DF1
-
18 Esquerdinha DF1
-
19 Field S. MD1
-
20 Dembele K. FW1
-
21 Cook S. DF1
H2H Stats
Team competitor
11
1.33
Scored / match
1.24
14
2
1.59
Conceded / match
1.22
17
3
2.91
Match goals average
2.46
18
5
64%
BTTS
57%
13
15
10.04
Match corners average
9.89
18
15
4.83
Team corners average
5.76
4
15
3.76
Match cards average
3.91
11
17
1.85
Team cards average
1.96
11
Most goal scorers
Queens Park Rangers Table
| # | Team | GP | W | D | L | G | GD | P |
|---|---|---|---|---|---|---|---|---|
| 1 | 46 | 28 | 11 | 7 | 97:45 | 52 | 95 | |
| 2 | 46 | 23 | 15 | 8 | 80:47 | 33 | 84 | |
| 3 | 46 | 24 | 11 | 11 | 64:49 | 15 | 83 | |
| 4 | 46 | 22 | 14 | 10 | 82:56 | 26 | 80 | |
| 5 | 46 | 22 | 14 | 10 | 72:47 | 25 | 80 | |
| 6 | 46 | 21 | 10 | 15 | 70:66 | 4 | 73 | |
| 7 | 46 | 19 | 14 | 13 | 69:65 | 4 | 71 | |
| 8 | 46 | 20 | 9 | 17 | 67:59 | 8 | 69 | |
| 9 | 46 | 19 | 8 | 19 | 63:56 | 7 | 65 | |
| 10 | 46 | 17 | 13 | 16 | 57:56 | 1 | 64 | |
| 11 | 46 | 18 | 10 | 18 | 57:59 | -2 | 64 | |
| 12 | 46 | 17 | 11 | 18 | 59:59 | 0 | 62 | |
| 13 | 46 | 18 | 6 | 22 | 66:66 | 0 | 60 | |
| 14 | 46 | 15 | 15 | 16 | 55:62 | -7 | 60 | |
| 15 | 46 | 16 | 10 | 20 | 61:73 | -12 | 58 | |
| 16 | 46 | 14 | 15 | 17 | 53:65 | -12 | 57 | |
| 17 | 46 | 15 | 10 | 21 | 51:56 | -5 | 55 | |
| 18 | 46 | 14 | 13 | 19 | 49:64 | -15 | 55 | |
| 19 | 46 | 13 | 14 | 19 | 44:58 | -14 | 53 | |
| 20 | 46 | 13 | 13 | 20 | 42:56 | -14 | 52 | |
| 21 | 46 | 13 | 14 | 19 | 48:58 | -10 | 51 | |
| 22 | 46 | 11 | 14 | 21 | 45:59 | -14 | 47 | |
| 23 | 46 | 12 | 16 | 18 | 58:68 | -10 | 46 | |
| 24 | 46 | 2 | 12 | 32 | 29:89 | -60 | 0 |
- Promotion
- Promotion Playoffs
- Relegation
| # | Team | GP | W | D | L | G | GD | P |
|---|---|---|---|---|---|---|---|---|
| 1 | 23 | 17 | 4 | 2 | 51:19 | 32 | 55 | |
| 2 | 23 | 14 | 8 | 1 | 43:17 | 26 | 50 | |
| 3 | 23 | 12 | 8 | 3 | 38:19 | 19 | 44 | |
| 4 | 23 | 12 | 8 | 3 | 39:22 | 17 | 44 | |
| 5 | 23 | 12 | 6 | 5 | 34:18 | 16 | 42 | |
| 6 | 23 | 13 | 3 | 7 | 33:25 | 8 | 42 | |
| 7 | 23 | 11 | 6 | 6 | 34:27 | 7 | 39 | |
| 8 | 23 | 11 | 5 | 7 | 35:34 | 1 | 38 | |
| 9 | 23 | 10 | 7 | 6 | 41:37 | 4 | 37 | |
| 10 | 23 | 10 | 7 | 6 | 30:27 | 3 | 37 | |
| 11 | 23 | 10 | 6 | 7 | 31:27 | 4 | 36 | |
| 12 | 23 | 8 | 10 | 5 | 28:25 | 3 | 34 | |
| 13 | 23 | 9 | 6 | 8 | 34:28 | 6 | 33 | |
| 14 | 23 | 10 | 3 | 10 | 40:37 | 3 | 33 | |
| 15 | 23 | 9 | 4 | 10 | 38:33 | 5 | 31 | |
| 16 | 23 | 9 | 4 | 10 | 33:31 | 2 | 31 | |
| 17 | 23 | 8 | 7 | 8 | 28:30 | -2 | 31 | |
| 18 | 23 | 9 | 4 | 10 | 23:26 | -3 | 31 | |
| 19 | 23 | 8 | 6 | 9 | 25:23 | 2 | 30 | |
| 20 | 23 | 9 | 3 | 11 | 27:28 | -1 | 30 | |
| 21 | 23 | 7 | 8 | 8 | 24:27 | -3 | 29 | |
| 22 | 23 | 7 | 7 | 9 | 31:34 | -3 | 28 | |
| 23 | 23 | 4 | 9 | 10 | 19:27 | -8 | 21 | |
| 24 | 23 | 1 | 7 | 15 | 14:44 | -30 | 10 |
| # | Team | GP | W | D | L | G | GD | P |
|---|---|---|---|---|---|---|---|---|
| 1 | 23 | 11 | 8 | 4 | 31:24 | 7 | 41 | |
| 2 | 23 | 11 | 7 | 5 | 46:26 | 20 | 40 | |
| 3 | 23 | 10 | 8 | 5 | 38:29 | 9 | 38 | |
| 4 | 23 | 10 | 6 | 7 | 44:37 | 7 | 36 | |
| 5 | 23 | 10 | 5 | 8 | 36:28 | 8 | 35 | |
| 6 | 23 | 10 | 5 | 8 | 35:32 | 3 | 35 | |
| 7 | 23 | 9 | 7 | 7 | 37:30 | 7 | 34 | |
| 8 | 23 | 9 | 7 | 7 | 28:28 | 0 | 34 | |
| 9 | 23 | 10 | 3 | 10 | 36:32 | 4 | 33 | |
| 10 | 23 | 8 | 7 | 8 | 26:28 | -2 | 31 | |
| 11 | 23 | 9 | 4 | 10 | 23:29 | -6 | 31 | |
| 12 | 23 | 9 | 2 | 12 | 28:33 | -5 | 29 | |
| 13 | 23 | 7 | 8 | 8 | 27:32 | -5 | 29 | |
| 14 | 23 | 7 | 4 | 12 | 23:32 | -9 | 25 | |
| 15 | 23 | 6 | 7 | 10 | 21:36 | -15 | 25 | |
| 16 | 23 | 6 | 7 | 10 | 24:41 | -17 | 25 | |
| 17 | 23 | 5 | 9 | 9 | 27:34 | -7 | 24 | |
| 18 | 23 | 4 | 10 | 9 | 21:32 | -11 | 22 | |
| 19 | 23 | 6 | 4 | 13 | 17:28 | -11 | 22 | |
| 20 | 23 | 4 | 8 | 11 | 23:38 | -15 | 20 | |
| 21 | 23 | 5 | 5 | 13 | 18:34 | -16 | 20 | |
| 22 | 23 | 5 | 4 | 14 | 20:33 | -13 | 19 | |
| 23 | 23 | 4 | 6 | 13 | 21:32 | -11 | 18 | |
| 24 | 23 | 1 | 5 | 17 | 15:45 | -30 | 8 |

Queens Park Rangers Squad
| Goalkeeper | Nationality | Age | Height |
|
|
||||
|---|---|---|---|---|---|---|---|---|---|
|
29
Hamer B.
|
|
38 | 193 | 7 | - | - | - | - | - |
|
1
Nardi P.
|
|
32 | 187 | 17 | - | - | 1 | - | 1 |
|
13
Walsh J.
|
|
24 | 185 | 23 | - | - | - | - | - |
| Defender | Nationality | Age | Height |
|
|
||||
|
5
Cook S.
|
|
35 | 185 | 30 | 1 | - | 2 | - | 7 |
| |
28 | 187 | 14 | - | - | 1 | - | 4 | |
|
3
Dunne J.
|
|
28 | 183 | 39 | 3 | 3 | 6 | - | - |
| |
27 | 181 | 38 | 1 | 1 | 9 | - | 5 | |
|
23
Morrison L.
|
|
23 | 183 | 12 | - | 1 | 3 | - | - |
|
27
Mbengue A.
|
|
24 | 180 | 41 | 2 | - | 12 | - | 5 |
|
21
Morgan K.
|
|
20 | 29 | 2 | 1 | 5 | - | 13 | |
|
28
Esquerdinha
|
|
20 | 183 | 16 | - | 1 | - | - | 9 |
| |
23 | 185 | 7 | - | - | 1 | - | 6 | |
|
37
Edwards R.
|
|
23 | 185 | 17 | 1 | 1 | 2 | - | - |
|
21
Larkeche Z.
|
|
23 | 182 | - | - | - | - | - | - |
|
30
Smith T.
|
|
21 | 182 | 3 | - | - | - | - | 3 |
| Midfielder | Nationality | Age | Height |
|
|
||||
|
15
Hayden I.
|
|
31 | 185 | 29 | - | 2 | 6 | - | 14 |
|
10
Chair I.
|
|
28 | 164 | 15 | 1 | 3 | 1 | - | 5 |
|
11
Smyth P.
|
|
28 | 175 | 36 | 6 | 3 | 8 | - | 15 |
|
24
Madsen N.
|
|
26 | 193 | 38 | 3 | 6 | 1 | - | 5 |
|
14
Saito K.
|
|
24 | 170 | 34 | 3 | 1 | - | - | 11 |
|
17
Poku K.
|
|
24 | 179 | 16 | - | - | 1 | - | 11 |
|
40
Varane J.
|
|
24 | 36 | 1 | 1 | 5 | - | 7 | |
|
20
Vale H.
|
|
22 | 180 | 31 | 4 | 5 | 3 | - | 5 |
|
23
Bennie D.
|
|
20 | 186 | 17 | 1 | 1 | 2 | - | 12 |
|
52
Scarlett L.
|
|
16 | 1 | - | - | - | - | 1 | |
| Forward | Nationality | Age | Height |
|
|
||||
|
99
Frey M.
|
|
31 | 190 | 13 | - | - | - | - | 11 |
|
9
Celar Z.
|
|
27 | 186 | 2 | - | - | - | - | 1 |
|
16
Burrell R.
|
|
25 | 180 | 30 | 10 | 3 | 4 | - | 8 |
| |
23 | 168 | 28 | 1 | - | 3 | - | 11 | |
|
26
Kolli R.
|
|
21 | 23 | 5 | - | 1 | - | 13 | |
|
22
Kone R.
|
|
22 | 43 | 10 | 2 | 7 | - | 5 | |
| |
19 | 173 | 1 | - | - | - | - | 1 | |
| Manager | Nationality | Age | Height |
|
|
||||
| |
45 | - | - | - | - | - | - |
- Matches played
- Total Goals
- Assists
- Yellow Cards
- Red Cards
- Substitute Appearances
Team news
Australia Loses Key Player to Injury Ahead of 2026 World Cup
Australian defender Lewis Miller will miss the 2026 World Cup after injuring his Achilles tendon while playing for English club Blackburn Rovers, Football Federation Aust...
17.02.2026 06:25
17.02.2026 06:25
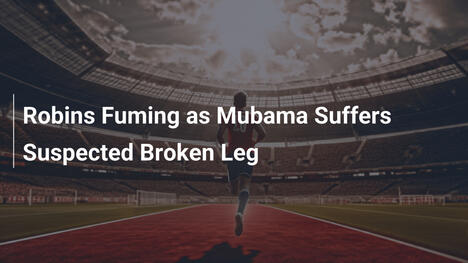
Robins Fuming as Mubama Suffers Suspected Broken Leg
Stoke City's ambitions were dealt a brutal blow in their difficult draw with QPR when striker Devin Mubama was taken off on a stretcher just after half-time with a suspec...
17.01.2026 14:17
17.01.2026 14:17

Stoke City Boss Robins Braces for Tough QPR Clash
Mark Robins is under no illusions that his Stoke City side are in for a real battle this weekend when they host Queens Park Rangers at the bet365 Stadium Kick-off is set ...
16.01.2026 11:01
16.01.2026 11:01